- amCharts5 지도 줌, overlay2022년 06월 10일 21시 32분 21초에 업로드 된 글입니다.작성자: sue24
Panning and Zooming
초기값
homeGeoPoint: 처음 위치homeZoomLevel: 처음 줌 레벨var chart = root.container.children.push( am5map.MapChart.new(root, { // 유럽이 중심인 세계지도 homeZoomLevel: 3.5, homeGeoPoint: { longitude: 10, latitude: 52 } }) ); // PolygonSeries가 하나라도 만들어져야 줌 가능 polygonSeries.events.on("datavalidated", function() { chart.goHome(); });리셋:
chart.goHome();줌 버튼 추가
chart.set("zoomControl", am5map.ZoomControl.new(root, {}));minusButton과 plusButton이 추가된다
Panning
panX: 수평으로 드래그할 때panY: 수직으로 드래그 할 때"none": 드래그해도 무반응
"rotateX(Y)": 지도 자체가 돌아간다
"translateX(Y)": 기본값. 지도 위 대륙이 돌아간다
panning out
지도의 어느 정도까지 밖으로 나갈 수 있을까(보이지 않게 된다)
chart의 maxPanOut으로 설정하는데 기본값은 0.4다
이는 지도의 40%까지 밖으로 나갈 수 있다는 뜻이다
Zooming
마우스 휠, 손가락 두 개로 벌리기, API 등 다양한 방법으로 줌 인/아웃 가능
Zoom steps
줌 레벨은 2씩 변하는 게 기본값인데
chart의 zoomStep으로 조절할 수 있다.
Limiting zoom
기본적으로 1~32
chart의 minZoomLevel/maxZoomLevel로 설정 가능
API
zoomToPoint()
특정 X/Y 픽셀을 중심으로 줌
zoomToGeoPoint()
특정 위도/경도 중심으로 줌
zoomIn()
zoomStep만큼 줌인
zoomOut()
zoomStep만큼 줌아웃
클릭한 오브젝트로 줌
polygonSeries.mapPolygons.template.events.on("click", function(ev) {
  polygonSeries.zoomToDataItem(ev.target.dataItem);
});
마우스 휠
wheelX/Y: 수평/수직으로 마우스 휠을 굴릴 때수평으로 굴리는 게 뭐지...?
"none"
"rotateX/Y"
"translateX/Y"
"zoom": wheelY의 기본값
sensitivity
chart의 wheelSensitivity.
기본값은 1
마우스 스크롤과 지도상의 줌이 헷갈릴 수 있으므로
ctrl키를 누르면 줌을 하고
아니면 스크롤을 하게 만드는 경우가 많다.
var chart = root.container.children.push(
  am5map.MapChart.new(root, {
    panX: "rotateX",
    projection: am5map.geoNaturalEarth1(),
    wheelY: "none"
    wheelSensitivity: 0.7
  })
);

var overlay = root.container.children.push(am5.Container.new(root, {
  width: am5.p100,
  height: am5.p100,
  layer: 100,
  visible: false
}));

var curtain = overlay.children.push(am5.Rectangle.new(root, {
  width: am5.p100,
  height: am5.p100,
  fill: am5.color(0x000000),
  fillOpacity: 0.3
}));

var message = overlay.children.push(am5.Label.new(root, {
  text: "Use CTRL + Scroll to zoom",
  fontSize: 30,
  x: am5.p50,
  y: am5.p50,
  centerX: am5.p50,
  centerY: am5.p50
}));

chart.events.on("wheel", function(ev) {
  if (ev.originalEvent.ctrlKey) {
    ev.originalEvent.preventDefault();
    chart.set("wheelY", "zoom");
  }
  else {
    chart.set("wheelY", "none");
    overlay.show();
    overlay.setTimeout(function() {
      overlay.hide()
    }, 800);
  }
});
ctrl을 눌러야 스크롤이 된다고 메세지를 띄워준다.
도시의 이름 가져오기
var overlay = root.container.children.push(am5.Container.new(root, {
    background: am5.Rectangle.new(root, {
        fill: am5.color(0xffffff),
            fillOpacity: 0.3
    }),
    width: am5.p100,
    height: am5.p100,
    layer: 100,
    visible: false
}));
countrySeries.mapPolygons.template.events.on("click", (e) => {
    let dataItem = e.target.dataItem;
    let data = dataItem.dataContext;
    console.log(data);
    var message = overlay.children.push(am5.Label.new(root, {
          text: data.id + data.name,
          fontSize: 30,
          x: am5.p50,
          y: am5.p50,
          centerX: am5.p50,
          centerY: am5.p50,
          fill: am5.color(0xff0000)
      }));
})
amCharts의 container는 배경색을 가질 수 없어서
새로 rectangle을 만들어서 처리해야 한다.
message는 overlay위에 지명을 띄워주기 위해 임시로 만들었다.
다만 이게 children에 push가 되게 만들어서
클릭 후 다른 걸 클릭하면 겹쳐서 올라온다.
저기서 찍은 data는 다음과 같다.
data {
  CNTRY: "Russia"
  TYPE: "Kray"
  TYPE_ENG: "Territory"
  geometry: {type: 'MultiPolygon', coordinates: Array(22)}
  geometryType: "MultiPolygon"
  id: "RU-KYA"
  madeFromGeoData: true
  name: "Krasnoyarsk"
}
여기에서 CNTRY와 name을 이용해서 오버레이에 정식으로 띄워본 그림은 다음과 같다.
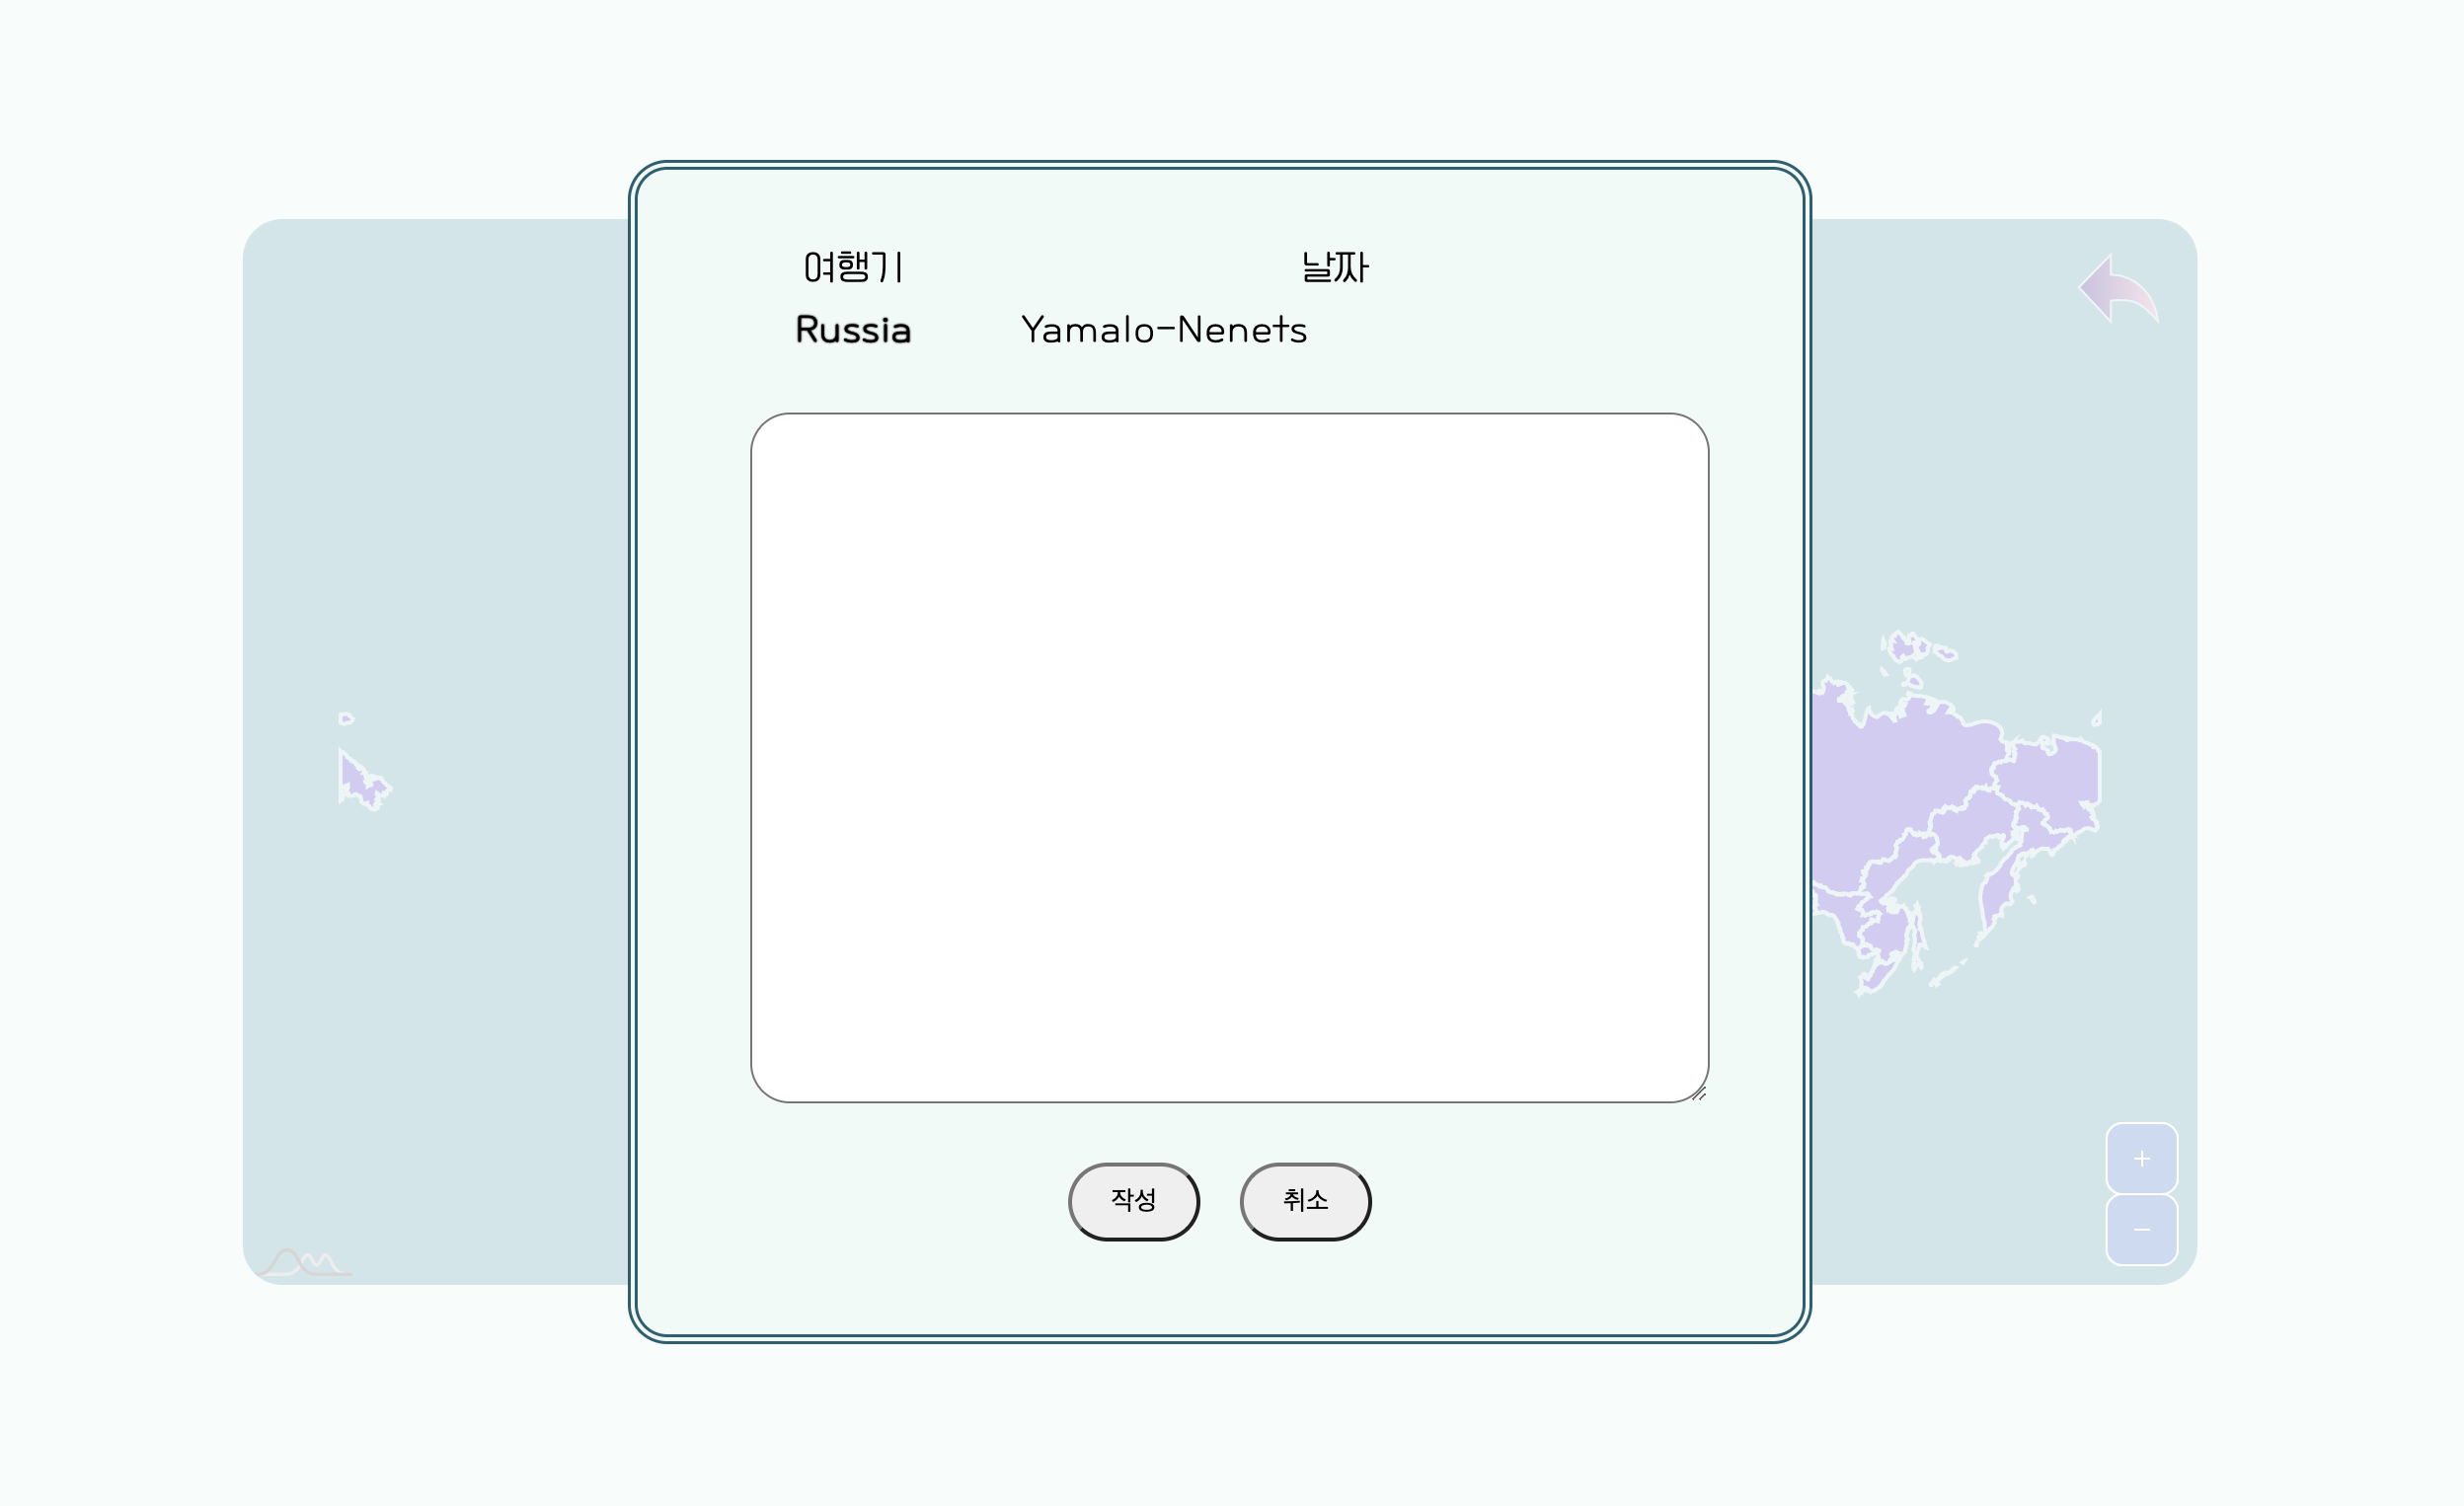
Russia의 Yamalo-Nenets라는 도시를 클릭한 결과다
오버레이는 화면 전체를 덮고 싶어서
지도에 push하는 방법 말고
보통 하는 것처럼 css와 js를 이용해서 만들었다
'JS' 카테고리의 다른 글
new FormData는 <form> submit과 다를까? (0) 2023.11.01 amCharts5 세계 지도 - 나라별 (0) 2022.06.09 amCharts5 튜토리얼 (0) 2022.06.08 함수도 오브젝트! (0) 2020.11.03 Objects and the dot (0) 2020.08.25 이전글이 없습니다.댓글